
Welcome to my 16th consecutive Europe winter forecast. In this forecast, the conclusions drawn for the upcoming meteorological winter period (December-February) are based on current climate state and global drivers at play including current global SST profile, ENSO, IOD, QBO & Solar!
Global Drivers
Coming off Solar Maximum
Unusually Weak Late Autumn Polar Vortex
MJO?

The run-up to the 25-26 season has a lot going for it but as is often the case, there are things we cannot ignore if you love winter. For example La Nina’s combined with EQBO’s tend to favour weaker polar vortexes.


We’re just coming off last year’s solar max, how much direct or indirect influence this has is unknown in my opinion.
Equally ‘where’ and how ‘strong’ the La Nina is can affect the MJO which then can drive the AO/NAO index. These teleconnections can work with and against one another, sometimes signaling significant pattern changes 10-14 even more days ahead. Other times including this current period, there’s high uncertainty when these drivers essentially work against each other creating real headaches. When 2 seemingly favourable signals for cold work against each other, this is known as constructive interference and that’s exactly what’s happening now.
SSTA’s or sea surface temperature anomaly (warm and cold) can play an important role in ridge/trough positions, jet stream intensity and ‘air mass distribution movement or lack of.

We are in the midst of one, if not thee earliest SSW (whether major or minor) since 1968 while we have a an MJO highly amplified pushing east across the Pacific 6-7.
Importance of ENSO/IOD/QBO & MJO!
The longer term positioning of warm vs cold SSTA’s can have significant influence on where the MJO and it’s branches of rising & sinking air position despite it’s normal rotation around the tropical planet.
Vertical ascent and decent, driven by surface winds through the tropical Indian and Pacific Oceans have the ability to drive the entire hemispheric pattern including what’s going on up within the stratosphere. The MJO!
While the MJO isn’t the be all and end all, when active and predictable, it can provide a big head’s up on a particular pattern. For example, mild, zonal, stormy patterns are often associated with phases 2-3-4 often resulting in a neutral to +AO/NAO. Or a wavier, more amplified jet and ridge/trough set-up with greater temperature extremes are often when the MJO is in phases 6 into 7-8 with resulting -AO/NAO.

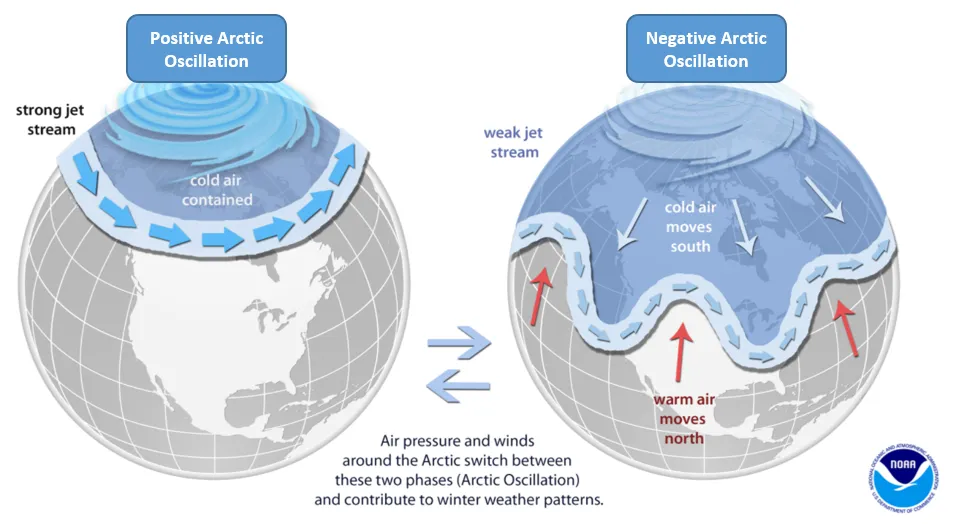
Positive/negative AO/NAO

While the background state of our planet’s climate is clearly warmer than just 10-15 years ago and the above teleconnections perhaps aren’t quite as reliable as they once were, cold as well as mild or stormy spells are still predictable depending upon strength of SPV, ENSO combined with MJO position. Cold spells within in our warmer world can still rival those of the colder past, albeit arguably shorter lived and less widespread. There’s a lean towards warmer winter’s than colder but colder winters still happen and will happen in the future, though less frequent. Alway’s remember, our default setting for winter is ‘Atlantic’.
Autumn ’25 has seen an interesting combination of weak La Nina, Easterly QBO and -IOD which combined are strongly linked to a weaker polar vortex. I believe it’s no coincidence we have a weak vortex as we enter this meteorological winter. The weak vortex could even be attributed to the unusual SSW which occurred back in September and now final warming over Antarctica through the Brewer-Dobson circulation. This cooling of the tropical troposphere with warming of the stratosphere over BOTH poles simultaneously could be why the MJO is unusually amplified.

It’s important to think ‘layers’ when it comes our atmosphere and polar vortex. There’s two main vortexes. The tropospheric vortex is closest to earth which is heavily influenced by planetary waves & land friction while the stratospheric vortex is on top and typically much stronger and circular with less friction the further away from earth’s surface.

A weaker polar vortex due to various outside forces suggests a weaker, wavier polar jet stream circling the hemisphere separating tropical-polar air masses. This weaker vortex and subsequent weaker jet provides greater opportunity for amplification and release of arctic air south but equally subtropical air north. While the big picture reflects greater variability, WHERE the warm and cold settles in a weaker PV setup is harder to pin point.

Factors such as La Nina (longer term) and MJO (shorter term) can sometimes but not always determine both strength of polar vortex and distribution of warm-cold air masses.
We’ve a clearly weak or very weak stratospheric polar vortex heading into winter.
RARE LATE NOVEMBER STRAT WARMING
Whether driven by combo of La Nina/EQBO/-IOD/earlier S Hem SSW, we’ve just witnessed an extremely unusual Nov SSW over the North Pole with wind reversal, albeit brief which constitutes a ‘minor’ event.


What’s this all mean?
A pool of cold builds through autumn, peaking in strength usually around the solstice. Stronger the circulation, the colder the core and winds surrounding it are. What causes it to weaken, stretch, split, collapse?
Strong vertical heat release from the MJO or strong high pressure cells circling the higher latitudes (upward propagating planetary waves) can push into the lower stratosphere creating ripples and force warming to occur. Ripples can turn into waves which cause distortion of the circulation (PV). This causes the polar night jet (mean zonal wind) to rapidly weaken and buckle. When these waves which started below gain momentum, you can cause the entire circulation to reverse, stretch or split. This is known as a MAJOR SSW when those winds reverse and temps within the SPV warm by as much as 50C within a few days. However, this energy then must propagate downwards through up-down reflection…
It’s important to see the higher pressure propagate down through the atmosphere from strat to troposphere but further more WHERE ridging develops.
As we enter December, we’re observing an amplified phase 6, heading for phase 7 MJO. Those on paper are phases which usually result in high latitude blocking but
In a standardised state, central based La Nina combined with -IOD (cold west-warm east Indian Ocean) drives strong westerlies over the Indian Ocean and easterlies over the Pacific with convergence where those winds meet… It’s typically above Indonesia/W Pacific which often drives MILDER for W Europe but throw in an EQBO and that changes the playing field but notice in the below graphic shared by Eric Webb, the pattern flips from cold to warm as you progress through winter.

I am particularly interested in past years with the above drivers in place along with weakening late autumn polar vortex.
Connection Between UK November Flood Events & Cold Spells?
As well as the above, I want to explore another element. WARM, WET Novembers and November’s which flipped from warm to cold…
Many moons ago, Chief Meteorologist Joe Bastardi of Weatherbell.com said that ‘where the wettest weather focuses in autumn or particularly late autumn (November), that’s ‘where the cold wants to go’…
The recent flooding rains (and warmth) of November 2025 combined with MJO progression, -IOD, EQBO and La Nina to years which turned cold in December following on from a flood event during November.
UK Floods 2000
Cumbria 2009
Cornwall 2010
Monmouthshire 2025?
Richard Traut dug deeper and picked out some interesting years…

30 years of La Nina December’s blended.

Early SSW’s occurred in 58, 68 and 2000
50mb

500mb

Let’s have a look at the 500mb geopotential heights of recent past years which some past December’s with similar strat warming at the 50mb level combined with MJO and how the 500mb looked.
2017?


2000


In December 2009 the MJO headed through 6-7-8 and we turned cold around 17th leading to a cold, snowy UK Christmas/New Year


Conflicting Signals
Being honest, I’ve really struggled in recent days, even weeks as my mind and gut has swayed back and forth regarding the potential outcome both in early winter as well as most of it. My mind keeps going to Dec 2013! Arctic waves descending into N America, powering up the jet which threw a series of lows our way. 2005 as well as 2015 too comes to mind.
We know the polar vortex is likely to remain at the very least weak through this December. That in itself raises opportunity for a blocking pattern and release of cold south and La Nina winter’s do tend to be colder during the first half of the season.
On the other hand, due to cold waters extending west towards the dateline, La Nina tends to hold the MJO over the Indian Ocean (phases 2-3) or Maritime Continent (phases 4-5) both of which favour a milder Atlantic driven pattern for W Europe.
That being said, the La Nina is expected to fade through winter but probably January or February which might be too late to have a significant difference in atmospheric response. Warm those waters into the CP and the MJO might be more attracted to phases 6-7-8 which are colder, blockier phases.
While most models show a weaker than normal mean zonal wind and polar vortex pretty much throughout winter, I suspect it could well strengthen mid winter (January) and therefore resulting in a +AO/NAO pattern later January-February which drives a milder 2nd half to winter, possibly stormy.
SEE LONG RANGE MEAN ZONAL WIND/MSLP CHARTS
Thoughts
While there’s plenty of positives from a cold perspective heading into December, I feel there’s a lot of unknowns with a simple non compliant ingredient which could make for two very different outcomes. For example ‘type’ of strat warming can be the difference between 2010 easterlies or 2013 Atlantic battering or just plain boring, mild high pressure. Essentially a seemingly very similar set of ingredients can deliver the variety of aforementioned results.
Based on latest guidance, 1) the troposphere doesn’t look likely to absorb this recent ‘Canadian warming’ 2) this type favours North America for cold waves and 3) zonality and flow increases linking Atlantic to Europe.
The 50mb level or lower stratosphere is something I look at for possible reflection beneath at the 500mb lasting 1-2 weeks after the initial.

This is clear week 1 of Dec in the 500mb & temp anomaly.


I feel slightly less concerned today compared to much of the past week in the fact what’s going on over the pole will see change (slow down) in angular momentum allowing the effects of the MJO phase 7 to take over through the 2nd half of December with blocking developing over the higher latitudes, again WHERE the ridge-trough couplets sit is crucial.

The result?

To reinforce this thought, The below 50mb (lower strat) for later Dec for more favourable blocking position over Greenland.

Weeklies show the building blocking over the top for late Dec!

There are signs of further waves of warming through the stratosphere and as just mentioned, type of warming and downward absorption is key.
The Forecast
December 2025
December is very tricky. Two elements which favour cold but by working against each other can deliver quite the different pattern type.
I’m going with a generally mild, wet west to southwest first 10-14 days over W Europe with change between 10-15th possibly 20th. S slowing of the flow and building of pressure north of the UK/Ireland region (perhaps a Scandi block) could develop. I believe we’ve a slightly increased change (60%) of a colder Christmas-New Year period with north, northeast or indeed east winds developing. Mild first half/colder 2nd half to December with a storm or two possible.
Average to above average temperatures, Average rainfall with variability across UK/Ireland
January 2026
Coming off the back of a cold New Year (providing continued weak PV & downwelling into trop), there’s a good chance, like observed last year, for a prolonged cold spell with decent opportunity for heavy snowfalls across many or most of the UK, Ireland and near continent. A firmly -AO/NAO setup through the first half of January with coldest weather of winter setting in. Widespread days below freezing with nights widely -5 to -10 with prone cold spots (N Eng, Highlands) witnessing another run at -20.
2nd half of January sees a thaw as MJO heads into either the stormier phases of 2-3 or mild 4-5.
Colder, drier than average month for UK/Ireland and much of W Europe including France, Low Countries, Scandi
February 2026
Average to above average temperature & rainfall for much of Western Europe with stronger polar vortex, +AO/NAO driven pattern with MJO in warmer phases.
The below is a possible outcome even in December IF the strat warming is the ‘wrong type’ and or MJO doesn’t behave.

I must state that confidence is lower than I would like due to conflicting signals. I have to say that my gut is leaning me towards the milder side of average in temperature and wetter for the Dec-Feb period. With December and February both looking warmer that tips the balance for the season.


Recent Comments