
The latest QPF (Quantative Precipitation Forecast) is printing out the biggest 7-day rain totals over the UK I’ve seen in quite some time. The reason? A boundary with lot’s of moisture and embedded disturbances running along it will become stuck over the N Republic and Scotland. While we’re in for a persistent wet, windy spell starting tonight/tomorrow and quite possibly lasting through early/mid next week, it’s the western upslopes of the Highlands which may see impressive totals. The direction of flow suggests a big rain and not snow event!
Remember back to Nov 2009 when Cumbria and SW Scotland was inundated by tremendous rains. This is starting to show and while southern Britain says ‘what’s all the fuss’, I say just wait till November, I don’t think you’ll get off that easy. This is a soggy late autumn and while we drool at folks in north and east Europe, let’s just see where that cold trough goes once we get into the cold season. I recon the freeze follows the flood!
Check out this 7 day precipitation chart. Impressive!

Credit: AccuWeather Pro

Credit: AccuWeather Pro
10 day

Credit: AccuWeather Pro

Credit: AccuWeather Pro
[s2If current_user_can(access_s2member_level1)]
Latest ECMWF surface chart shows the stalled front over Scotland Sat through Tuesday, held in place by ridging to the SE.

Credit: AccuWeather Pro

Credit: AccuWeather Pro

Credit: AccuWeather Pro

Credit: AccuWeather Pro
Check out the similarity to the above vs the surface map back on Nov 19, 2009 which brought the Cumbrian flood. I expect more of these long fetch, moisture rich ‘stuck’ flows pointing the hose into the UK during November.

Credit: Met Office
That front eventually clears and decays to the SE only to give way to the next low.
Does Siberia And It’s Snow Hold The Key?
Siberian snow pack is growing at a record or near record rate (5x normal) with the greatest expanse for this time of year since at least 2000.
What does this mean for us? Cold air is growing and maturing faster than normal. Where does OUR coldest air come from? SIBERIA. Siberia really can hold the key to what kind of winter we get as it can force more negative AO and NAO’s in winter and can even lead to more enhanced strat warming events.
Take a look at the comparison between Oct 17, 2013 vs Oct 17, 2014.

ECMWF 10 day SNOW COVER chart for Asia is impressive for this early.

Credit: AccuWeather Pro
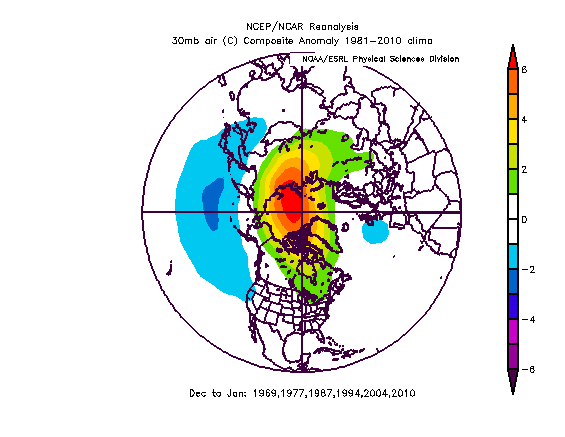
Interestingly we have a strat warming event going on right now, where? OVER the Siberian snow pack!
East QBO’s lead to this 500mb geopotential height anomaly over the pole.

See video for discussion.
[/s2If][s2If current_user_cannot(access_s2member_level1)][magicactionbox id=”18716″][/s2If]


")


Recent Comments